BOLD images
One individual report per input functional timeseries will be generated
in the path <output_dir>/reports/sub-IDxxx_task-name_bold.html`.
An example report is given
here.
The individual report for the functional images is structured as follows:
Summary
The first section summarizes some important information:
subject identifier, date and time of execution of
mriqc, software version;workflow details and flags raised during execution; and
the extracted IQMs.
Visual reports
The section with visual reports contains:
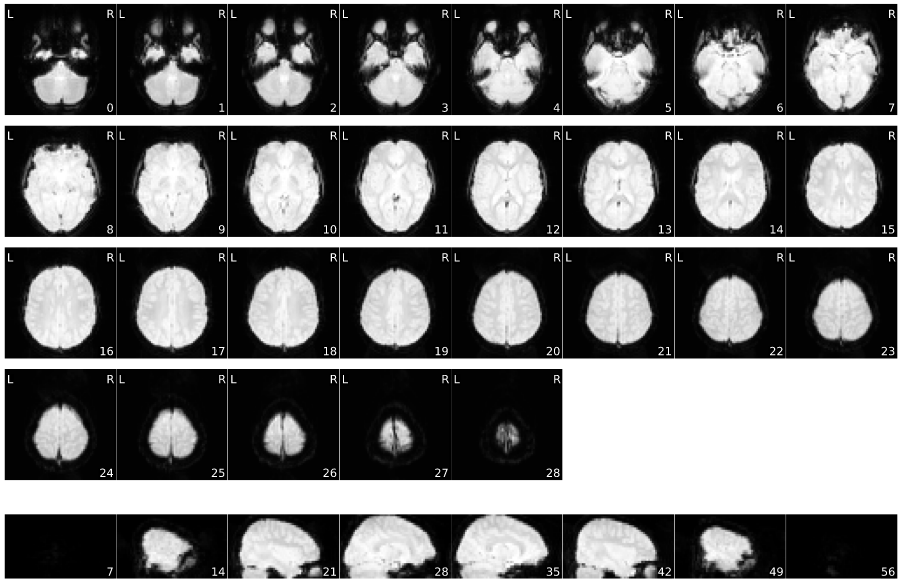
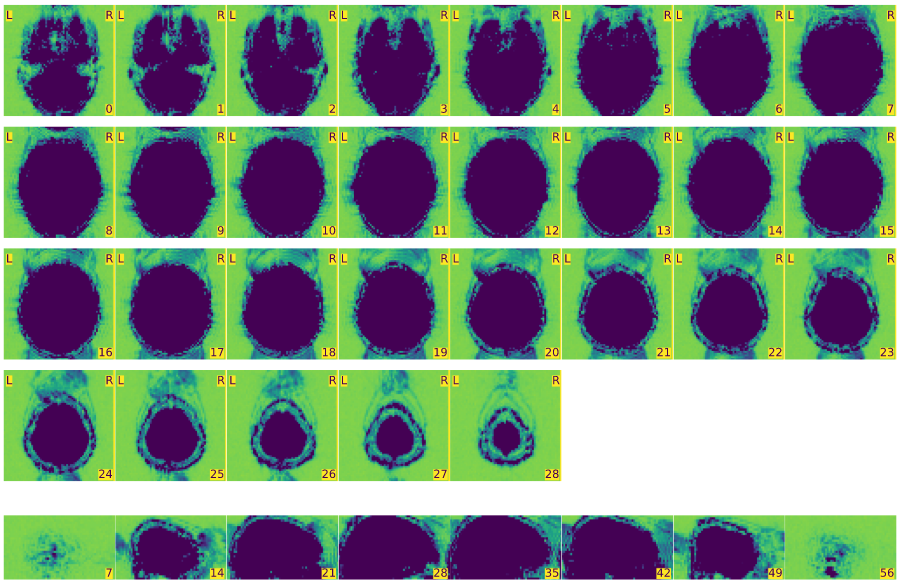
Mosaic view of the average BOLD signal.
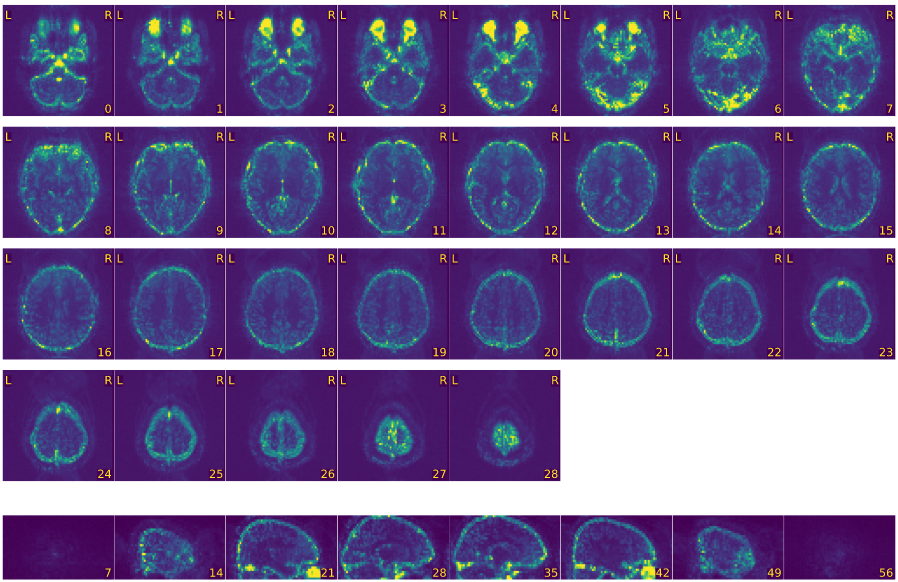
Mosaic view of the temporal standard deviation.
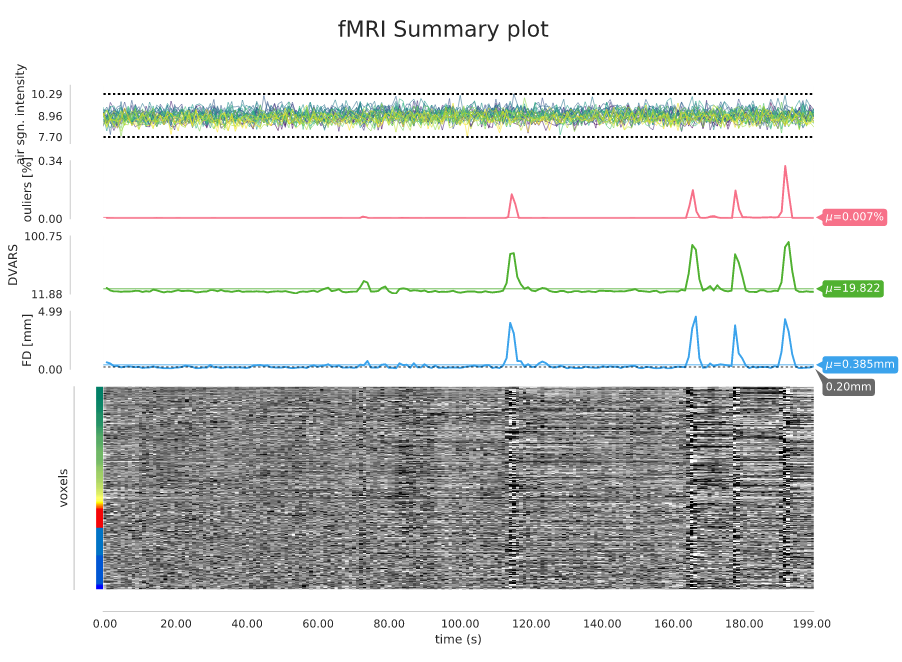
Summary plot, showing the slice-wise signal intensity at the extremes for the identification of spikes, the outliers metric, the DVARS and the FD. Finally the so-called carpetplot [Power2016]
Verbose reports
If mriqc was run with the --verbose-reports flag, the
following plots will be appended:
Mosaic view of the average BOLD signal, zoomed-in to the bounding box of brain activation.
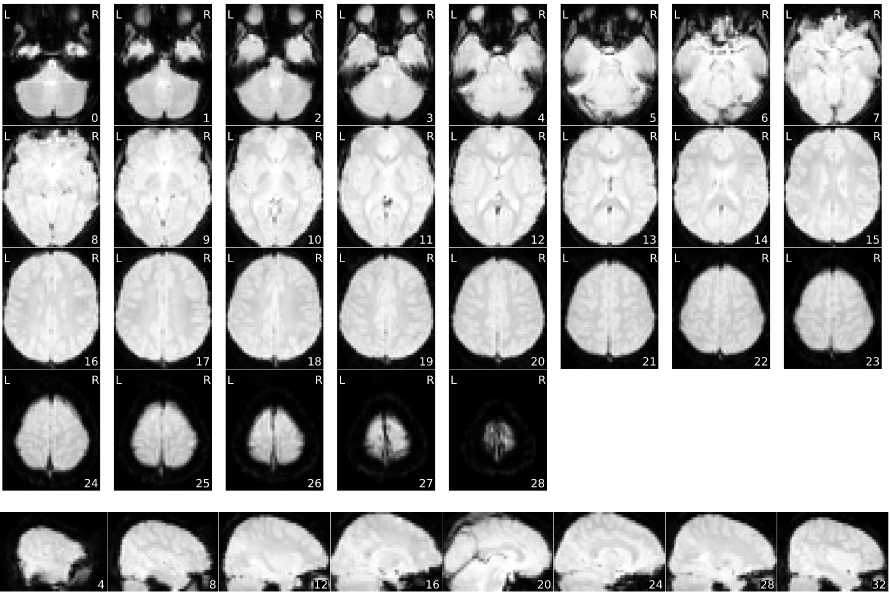
Mosaic view of the average BOLD signal, with background enhancement.
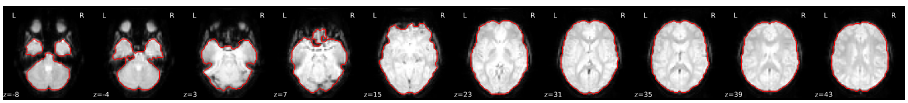
One rows of axial views at different Z-axis points showing the calculated brain mask.
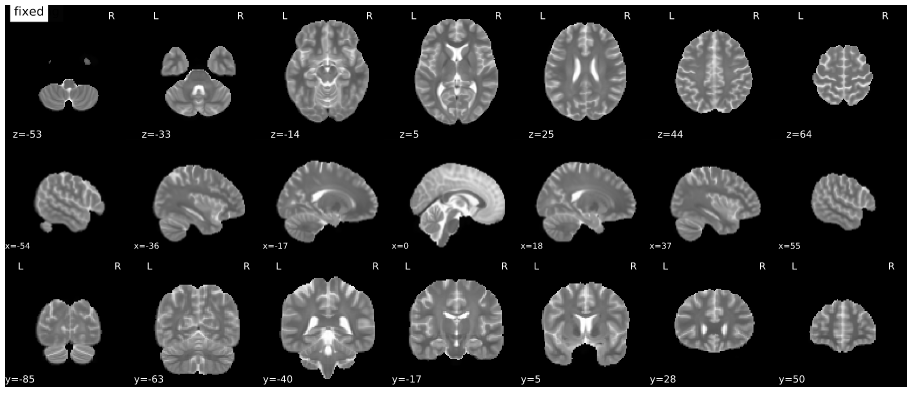
Mosaic view with animation for assessment of the co-registration to MNI space (roll over the image to activate the animation).
Metadata
If some metadata was found in the BIDS structure, it is reported here.
References
- Power2016
Power JD, A simple but useful way to assess fMRI scan qualities. NeuroImage. 2016. doi: 10.1016/j.neuroimage.2016.08.009