IQMs for functional images
Measures for the spatial information
Definitions are given in the summary of structural IQMs.
Entropy-focus criterion (
efc()).
Foreground-Background energy ratio (
fber(), [Shehzad2015]).
Full-width half maximum smoothness (
fwhm_*, see [Friedman2008]).
Signal-to-noise ratio (
snr()).
Summary statistics (
summary_stats()).
Measures for the temporal information
- DVARS
D referring to temporal derivative of timecourses, VARS referring to RMS variance over voxels ([Power2012]
dvars_nstd) indexes the rate of change of BOLD signal across the entire brain at each frame of data. DVARS is calculated with nipype after motion correction:\[\text{DVARS}_t = \sqrt{\frac{1}{N}\sum_i \left[x_{i,t} - x_{i,t-1}\right]^2}\]Note
Intensities are scaled to 1000 leading to the units being expressed in x10 \(\%\Delta\text{BOLD}\) change.
Note
MRIQC calculates two additional standardized values of the DVARS. The
dvars_stdmetric is normalized with the standard deviation of the temporal difference time series. Thedvars_vstdis a voxel-wise standardization of DVARS, where the temporal difference time series is normalized across time by that voxel standard deviation across time, before computing the RMS of the temporal difference [Nichols2013].
- Global Correlation (
gcor) calculates an optimized summary of time-series correlation as in [Saad2013] using AFNI’s
@compute_gcor:\[\text{GCOR} = \frac{1}{N}\mathbf{g}_u^T\mathbf{g}_u\]where \(\mathbf{g}_u\) is the average of all unit-variance time series in a \(T\) (# timepoints) \(\times\) \(N\) (# voxels) matrix.
- Temporal SNR (tSNR,
tsnr) is a simplified interpretation of the tSNR definition [Kruger2001]. We report the median value of the tSNR map calculated like:
\[\text{tSNR} = \frac{\langle S \rangle_t}{\sigma_t},\]where \(\langle S \rangle_t\) is the average BOLD signal (across time), and \(\sigma_t\) is the corresponding temporal standard-deviation map. Higher values are better.
Measures for artifacts and other
- Framewise Displacement
expresses instantaneous head-motion [Jenkinson2002]. MRIQC reports the average FD, labeled as
fd_mean. Rotational displacements are calculated as the displacement on the surface of a sphere of radius 50 mm [Power2012]:\[\text{FD}_t = |\Delta d_{x,t}| + |\Delta d_{y,t}| + |\Delta d_{z,t}| + |\Delta \alpha_t| + |\Delta \beta_t| + |\Delta \gamma_t|\]Along with the base framewise displacement, MRIQC reports the number of timepoints above FD threshold (
fd_num), and the percent of FDs above the FD threshold w.r.t. the full timeseries (fd_perc). In both cases, the threshold is set at 0.20mm.
- Ghost to Signal Ratio (
gsr()) labeled in the reports as
gsr_xandgsr_y(calculated along the two possible phase-encoding axes x, y):\[\text{GSR} = \frac{\mu_G - \mu_{NG}}{\mu_S}\]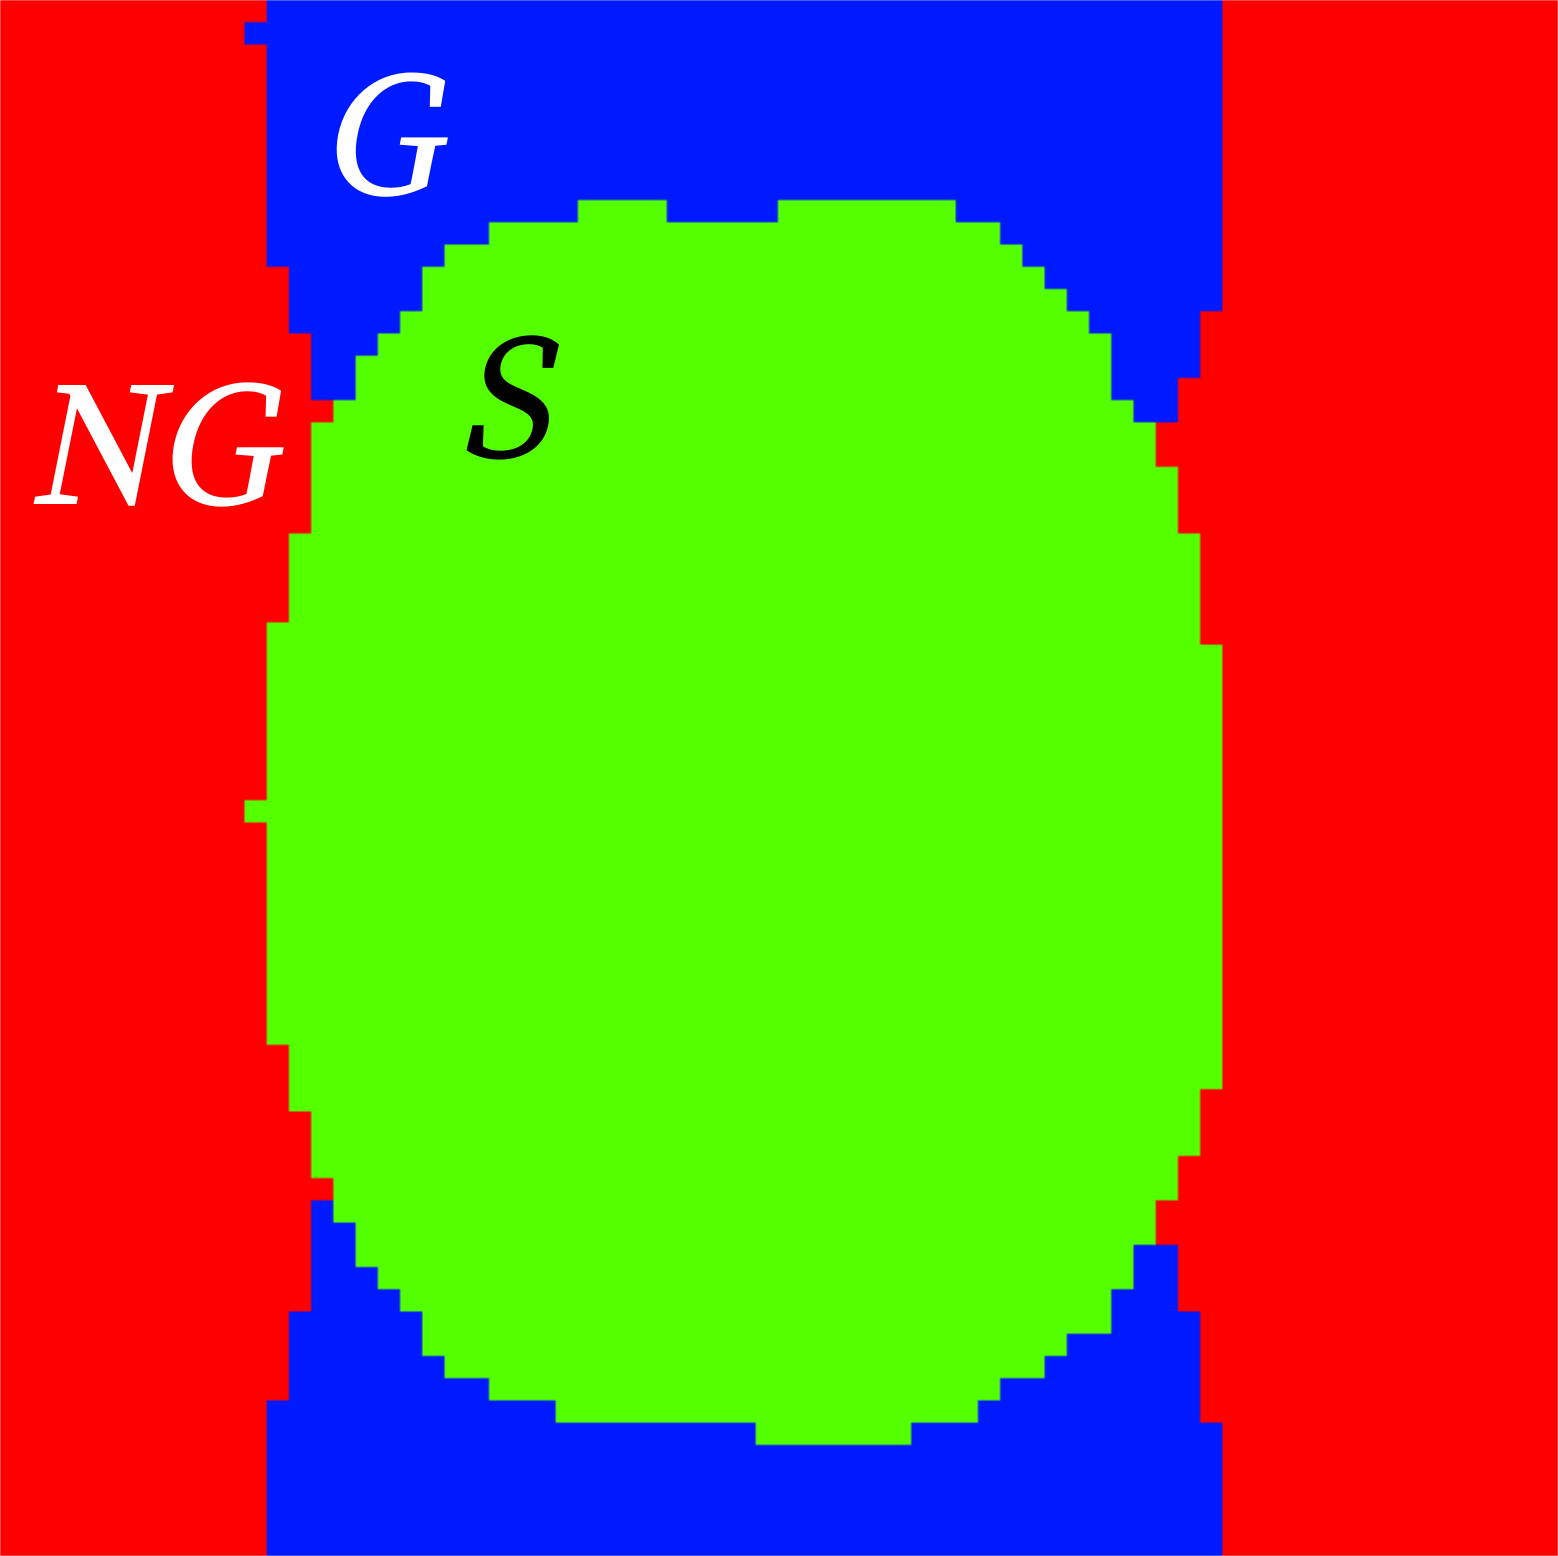
- AFNI’s outlier ratio (
aor) Mean fraction of outliers per fMRI volume as given by AFNI’s
3dToutcount.
- AFNI’s quality index (
aqi) Mean quality index as computed by AFNI’s
3dTqual; for each volume, it is one minus the Spearman’s (rank) correlation of that volume with the median volume. Lower values are better.
- Number of dummy scans** (
dummy) A number of volumes in the beginning of the fMRI timeseries identified as non-steady state.
- mriqc.qc.functional.gsr(epi_data, mask, direction='y', ref_file=None, out_file=None)[source]
Compute the GSR [Giannelli2010].
The procedure is as follows:
Create a Nyquist ghost mask by circle-shifting the original mask by \(N/2\).
Rotate by \(N/2\)
Remove the intersection with the original mask
Generate a non-ghost background
Calculate the GSR
Warning
This should be used with EPI images for which the phase encoding direction is known.